Learn how to switch between Candlestick and line charts
Candlestick charts provide more information than regular line charts. Users can see the high, low, open, and close for a specific period. Indicators such as MACD, Bollinger Bands, Moving averages, and more are available.
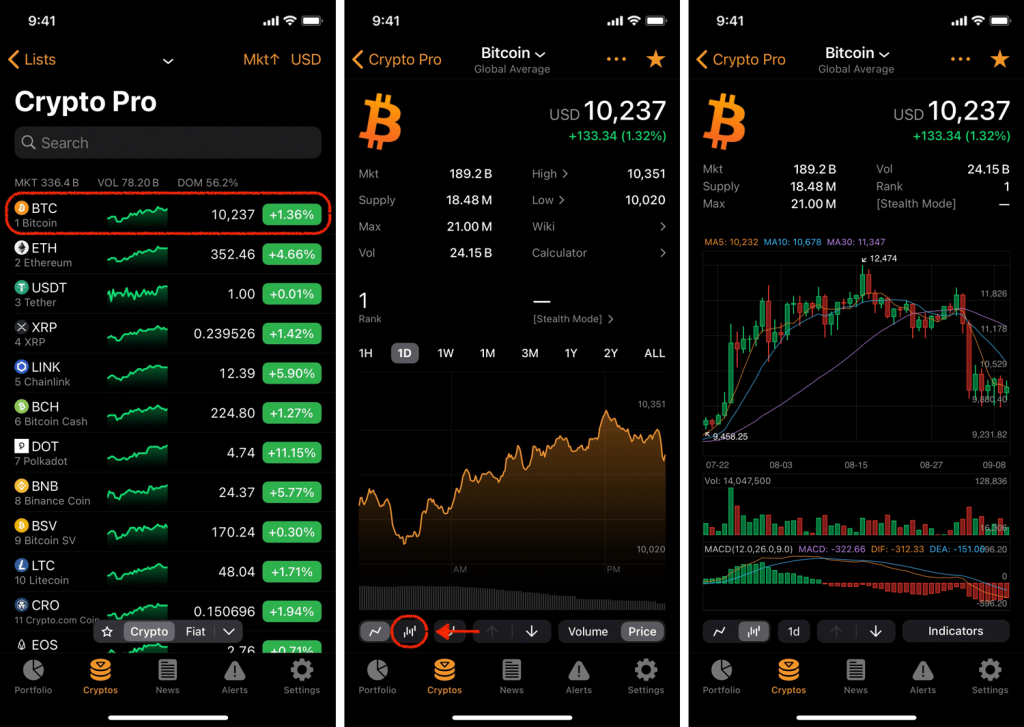
Display Candlestick charts:
- Go to ‘Cryptos’ tab
- Tap on any cryptocurrency
- Tap on the ⑇ in the bottom left corner
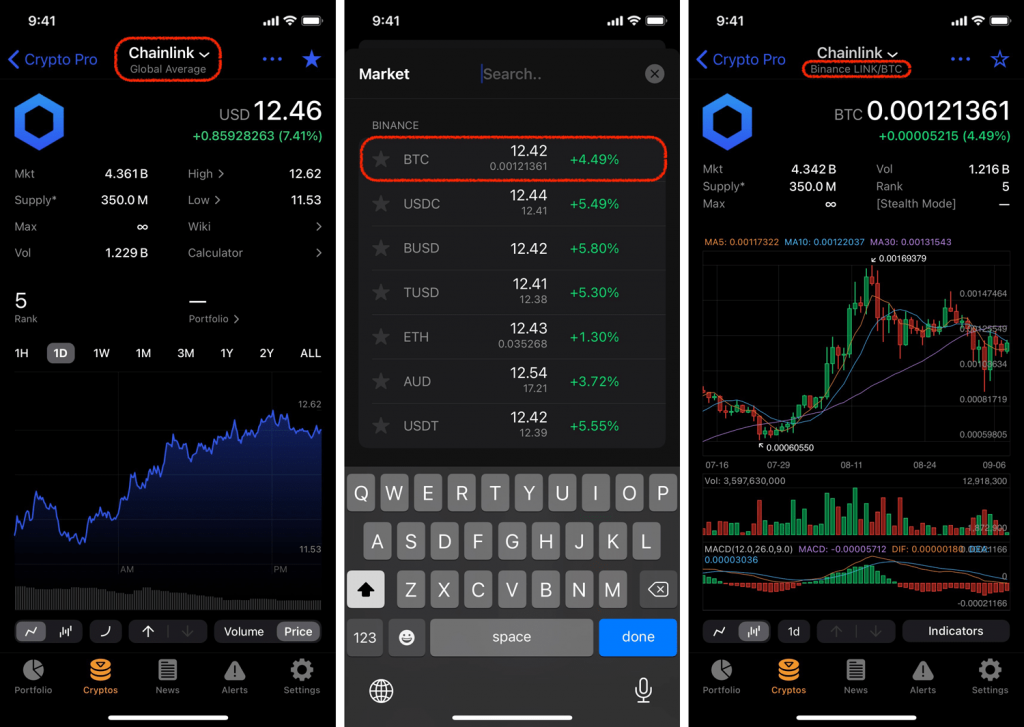
You can also view candlestick charts for crypto to crypto pairs such as LINK/BTC
- Open coin page for any cryptocurrency
- Tap on the crypto name in the top center
- Select the exchange and trading pair e.g. LINK/BTC on Binance